During the last 25 years to March 2024, the average property price in England* rose from circa £70,612 to £305,879 representing a property value increase of approximately 433%.
Transaction data extracted from the Government’s Office for National Statistics (ONS) for England confirms that the average annual compound growth in house prices was approximately 6.0% over the last 25 years.
The graph opposite illustrates that whilst there are irregular cycles of house price growth, the increase is linear over the medium term.
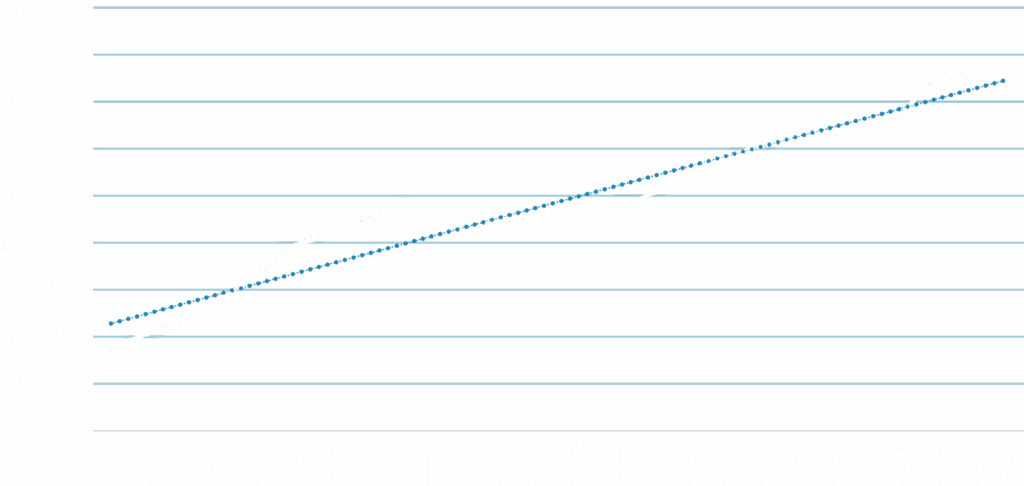
Source: Sales data extracted December 2024 from the ONS for England
|
VPV |
£250,000
|
Investment Price
|
£106,607
|
|
Percentage Share |
100%
|
Discount |
£143,393
|
|
VPV Share
|
£250,000
|
Discount %
|
57%
|
| Term | Future VPV | Reversion Gain | ROI |
|---|---|---|---|
|
5 Years
|
£304,163
|
£197,556
|
185%
|
|
10 Years
|
£370,061
|
£263,454
|
247%
|
|
15 Years
|
£450,236
|
£343,628
|
322%
|
|
20 Years
|
£547,781
|
£441,173
|
414%
|
|
VPV |
£250,000
|
Investment Price
|
£148,326 |
|
Percentage Share |
100%
|
Discount |
£101,674 |
|
VPV Share
|
£250,000
|
Discount %
|
41%
|
| Term | Future VPV | Reversion Gain | ROI |
|---|---|---|---|
|
5 Years
|
£304,163
|
£155,838
|
105%
|
|
10 Years
|
£370,061
|
£221,735
|
149%
|
|
15 Years
|
£450,236
|
£301,910
|
204%
|
|
20 Years
|
£547,781
|
£399,455
|
269%
|
|
VPV |
£250,000
|
Investment Price
|
£89,317
|
|
Percentage Share |
75%
|
Discount |
£98,183
|
|
VPV Share
|
£187,500
|
Discount %
|
52%
|
| Term | Future VPV | Reversion Gain | ROI |
|---|---|---|---|
|
5 Years
|
£228,122
|
£138,805
|
155%
|
|
10 Years
|
£277,546
|
£188,229
|
211%
|
|
15 Years
|
£337,677
|
£248,360
|
278%
|
|
20 Years
|
£410,836
|
£321,519
|
360%
|
In the example below, it would take circa 20 years of house price deflation at 4% per year for the investor to make a gross loss* on their investment.
|
VPV |
£250,000 |
Investment Price
|
£113,185 |
|
Percentage Share |
100%
|
Discount |
£136,815 |
|
VPV Share
|
£250,000
|
Discount %
|
55%
|
| Term | Future VPV | Reversion Gain | ROI |
|---|---|---|---|
|
5 Years
|
£203,843 |
£90,658
|
80% |
|
10 Years
|
£166,208 |
£53,023
|
47% |
|
15 Years
|
£135,522 |
£22,337
|
20%
|
|
20 Years
|
£110,501 |
(£2,684)
|
-2%
|
* Gross loss does not take into consideration sales, legal or any other fees or costs. It also assumes the Life Tenancy has ended.
VPV = Vacant Possession Valuation, PVPV = Proportional Vacant Possession Valuation